Smart Dashboards & Brokerage Intelligence
In today’s fiercely competitive real estate market, data is no longer a back-office asset — it is the front-line competitive advantage. Brokerages that rely on gut instinct and end-of-month spreadsheets are being outpaced by those leveraging smart dashboards and real-time business intelligence platforms.
Smart Dashboards for real estate brokerages are purpose-built analytics environments that aggregate, visualize, and contextualize data across every dimension of the business — from individual agent performance to market-wide investment trends. They don’t just show you what happened; they help you understand why it happened and what to do next.
This blog explores the six core pillars of Brokerage Intelligence and how each one drives measurable value for brokerages, agents, investors, and clients alike.
01. Real-Time Portfolio Analytics
Real-Time Portfolio Analytics provides live, continuously updated visibility into a brokerage’s entire property portfolio through intelligent dashboards. Instead of relying on static spreadsheets or delayed monthly reports, firms gain instant insights as transactions, leases, and deal stages change.
Below are the core components of Real-Time Portfolio Analytics:
• Financial Performance Tracking
Monitor key portfolio metrics in real time:
- Net Operating Income (NOI)
- Rent collected vs. projected revenue
- Vacancy and occupancy rates
- Commission and revenue forecasts
This enables leadership to understand financial health instantly.
• Deal Pipeline Visibility
Track the status of listings and transactions:
- Active listings by stage
- Offers received and probability to close
- Days on market
- Quarterly revenue projections
Helps management identify bottlenecks and forecast growth accurately.
• Lease & Tenant Intelligence
Gain proactive oversight into leasing performance:
- Upcoming lease expirations
- Tenant concentration risk
- Rent escalation schedules
- Renewal probability trends
Reduces revenue risk and supports strategic planning.
• Agent & Brokerage Performance Metrics
Measure productivity and conversion performance:
- Lead-to-close ratio
- Revenue per agent
- Listing performance analytics
- Marketing ROI tracking
Supports data-driven team management.
• Market & Portfolio Insights
Analyze performance at a broader level:
- Price-per-square-foot trends
- Submarket comparisons
- Asset-type performance
- Geographic heatmaps
Guides investment and expansion decisions.
Real-Time Portfolio Analytics is powered by centralized property databases, CRM integrations, automated OM data extraction, and business intelligence tools. As soon as new data enters the system, dashboards update automatically.
In short, it transforms brokerages from manual reporting operations into intelligent, data-driven organizations capable of making faster and more informed decisions.
02. Listing Performance Tracking
Every listing tells a story. Whether a property sells in 4 days or sits for 90 days before a price reduction, there are data signals behind each outcome. Listing performance tracking dashboards capture these signals systematically — enabling brokerages to diagnose problems early and replicate successes.
What gets tracked in a listing performance dashboard:
- Views & click-through rates: How many users saw the listing on portals (Zillow, Realtor.com, MLS) and how many clicked for more details?
- Lead source attribution: Are inquiries coming from social media, paid search, organic MLS, or agent referrals? This informs marketing budget decisions.
- Days on market (DOM) benchmarking: Compare active listings against neighborhood DOM averages to flag stale listings before they become problematic.
- Price reduction history: Automated alerts when a listing exceeds thresholds without inquiries, prompting pricing conversations with sellers.
- Showing-to-offer conversion: Track how many showings convert to offers, and identify listings with high showings but low conversion — often a pricing or presentation signal.
- Photography & virtual tour engagement: Which listings with 3D tours or drone photography generate more views and faster closings?
Armed with this data, listing agents can have objective, data-backed conversations with sellers about pricing strategy, marketing enhancements, and timeline expectations — replacing uncomfortable guesswork with evidence.
03. Agent Productivity Dashboards
Managing a team of 20 agents looks very different from managing a team of 200. But in both cases, the challenge is the same: how do you know who needs coaching, who deserves recognition, and who is quietly underperforming before it’s too late?
Agent productivity dashboards give broker-owners and team leaders a real-time, objective view of performance at both the individual and team level. They serve two equally important purposes — accountability and coaching.
Core metrics tracked include:
- Pipeline health: Number of active leads, appointments set, offers submitted, and contracts in progress — at a glance for every agent.
- Transaction volume & GCI: Gross commission income earned YTD versus targets, by agent and by team.
- Lead response time: Speed of follow-up with new leads (a critical conversion factor that can be monitored and improved with visibility).
- Conversion rates by stage: Lead-to-appointment, appointment-to-contract, contract-to-close — where is each agent losing deals?
- Activity tracking: Calls made, emails sent, open houses hosted, referrals generated — measuring effort, not just outcomes.
- Peer benchmarking: Anonymized or named comparisons to team averages help motivate underperformers and validate top performers.
Beyond performance management, these dashboards support smarter hiring decisions (what does a top performer profile look like?), more effective training programs, and retention strategies. Agents who see their own data are more self-motivated to improve — visibility drives accountability without constant managerial intervention.
04. Commission & Revenue Reports
Commission management is one of the most operationally complex aspects of running a brokerage. Variable commission splits, tiered structures, referral fees, transaction fees, team overrides, and cap provisions create a web of calculations that, when managed manually, lead to errors, disputes, and lost revenue.
Smart commission and revenue dashboards automate and visualize this complexity, delivering clarity for both the brokerage and its agents.
Key features of a commission intelligence dashboard:
- Automated commission calculation: Apply split rules, caps, and referral deductions automatically upon transaction close — reducing errors and processing time.
- Revenue forecasting: Based on pipeline data, project gross commission income for the next 30, 60, and 90 days.
- Expense vs. revenue breakdown: Track brokerage expenses (marketing, technology, office costs) against income to monitor profitability in real time.
- Agent cap tracking: Real-time visibility for agents and managers on how close each agent is to their annual commission cap.
- Referral fee management: Track inbound and outbound referrals, associated fees, and payment status automatically.
- Tax & compliance reporting: Generate 1099 data, state licensing fee allocations, and audit-ready transaction histories with a click.
- Revenue by source: Which lead sources, agent teams, or property types are driving the most revenue? Identify the highest-ROI activities.
Beyond operational efficiency, these reports power strategic decisions. When a brokerage can see that buyer transactions are outperforming seller transactions by 20%, or that one team accounts for 40% of revenue, they can make informed decisions about recruitment, compensation plan design, and market focus.
05. Investment ROI Dashboard
For brokerages serving investor clients — whether individual house flippers, BRRRR investors, or institutional funds — the ability to calculate, visualize, and communicate investment returns is a critical value-add that differentiates sophisticated brokerages from transactional ones.
An Investment ROI Dashboard goes far beyond simple profit/loss calculations. It provides a multi-dimensional view of investment performance across the asset lifecycle.
What an ROI dashboard tracks:
- Cash-on-cash return: Annual pre-tax cash flow divided by total cash invested — the most immediate measure of an investment’s income performance.
- Internal rate of return (IRR): The annualized return accounting for the time value of money and the full investment timeline, including exit.
- Equity growth tracking: Visualize how mortgage paydown plus appreciation is building equity over time.
- Renovation ROI analysis: Which improvements (kitchen remodel, roof replacement, landscaping) yielded the highest return at sale?
- Hold vs. sell analysis: At what projected value or time does selling outperform continued holding and renting?
- Portfolio-level blended returns: Aggregate performance across all investor holdings for a true wealth-building picture.
- Market-relative performance: How is the investment performing versus local property appreciation benchmarks?
For brokerages, this capability creates a powerful client retention tool. When investors can log in and see exactly how their assets are performing — with professional-grade metrics previously reserved for institutional finance — the brokerage becomes an indispensable strategic partner rather than just a transaction facilitator.
06. Market Heatmaps & Trend Visualization
Numbers in tables tell part of the story. But when market data is mapped geographically and visualized temporally, patterns emerge that spreadsheets simply cannot reveal. Market heatmaps and trend visualization tools are the most externally compelling component of a brokerage intelligence platform — equally valuable for internal strategy and client-facing presentations.
Heatmap and visualization capabilities include:
- Price per square foot heatmaps: Visualize which neighborhoods command premium pricing and identify micro-market opportunities by geography.
- Days-on-market by zone: Overlay DOM data geographically to identify where inventory is tightest and buyer competition is most intense.
- Sold price vs. list price ratios: Map where bidding wars are happening versus where sellers are accepting discounts — essential for offer strategy.
- Price trend timelines: Animated or time-series charts showing how median prices in specific zip codes have moved over 1, 3, or 5 years.
- New construction activity: Track permit filings, new development projects, and their likely impact on supply and pricing in target areas.
- Demographic & migration trend overlays: Where are population flows moving? Which markets are attracting net inflows of high-income households?
- School district & walkability scoring: Visualize non-price quality-of-life factors that drive buyer preferences and asset values.
- Foreclosure & distressed property mapping: Identify opportunity zones for investors seeking below-market acquisitions.
From a business development perspective, market heatmaps serve as powerful content marketing assets. A brokerage that publishes quarterly local market reports powered by their own visualization tools builds brand authority, attracts organic web traffic, and positions agents as the definitive local market experts.
How It All Connects: The Unified Intelligence Layer
The true power of Smart Dashboards & Brokerage Intelligence isn’t in any single module — it’s in the integration. When portfolio analytics, listing performance, agent productivity, commission data, investment ROI, and market visualization are connected in a unified platform, the whole becomes exponentially greater than the sum of its parts.
Consider a few examples of cross-functional intelligence:
- Agent A is underperforming on conversions in Zip Code X.
- Market heatmaps show that Zip Code X has 60+ DOM average — a tough micro-market.
- Listing performance data confirms that properties above $750K are stagnating there.
- This insight leads to a coaching conversation, a listing strategy adjustment, and a smarter pricing approach for the agent’s next listing.
This kind of synthesis — pulling threads from multiple data streams to drive a specific business decision — is what separates intelligence from mere reporting. It’s only possible when data lives in a connected system rather than fragmented tools.
The Future-Ready Brokerage Starts With Data
The real estate industry is undergoing a fundamental data transformation. Regulatory changes, digital-first buyer behavior, compressed margins, and increased competition from iBuyers and tech-enabled brokerages are forcing every traditional brokerage to either evolve or be left behind.
Smart Dashboards and Brokerage Intelligence are not luxury features for enterprise firms. They are becoming table stakes for any brokerage that intends to grow, retain top talent, serve sophisticated clients, and operate with the efficiency that modern markets demand.
The six pillars outlined in this blog — real-time portfolio analytics, listing performance tracking, agent productivity dashboards, commission and revenue reporting, investment ROI analysis, and market heatmaps — represent a complete intelligence framework. Together, they give brokerage leaders the visibility to lead confidently, agents the data to perform at their best, and clients the transparency to trust completely.
The brokerages building these capabilities today are the ones that will define the industry tomorrow.
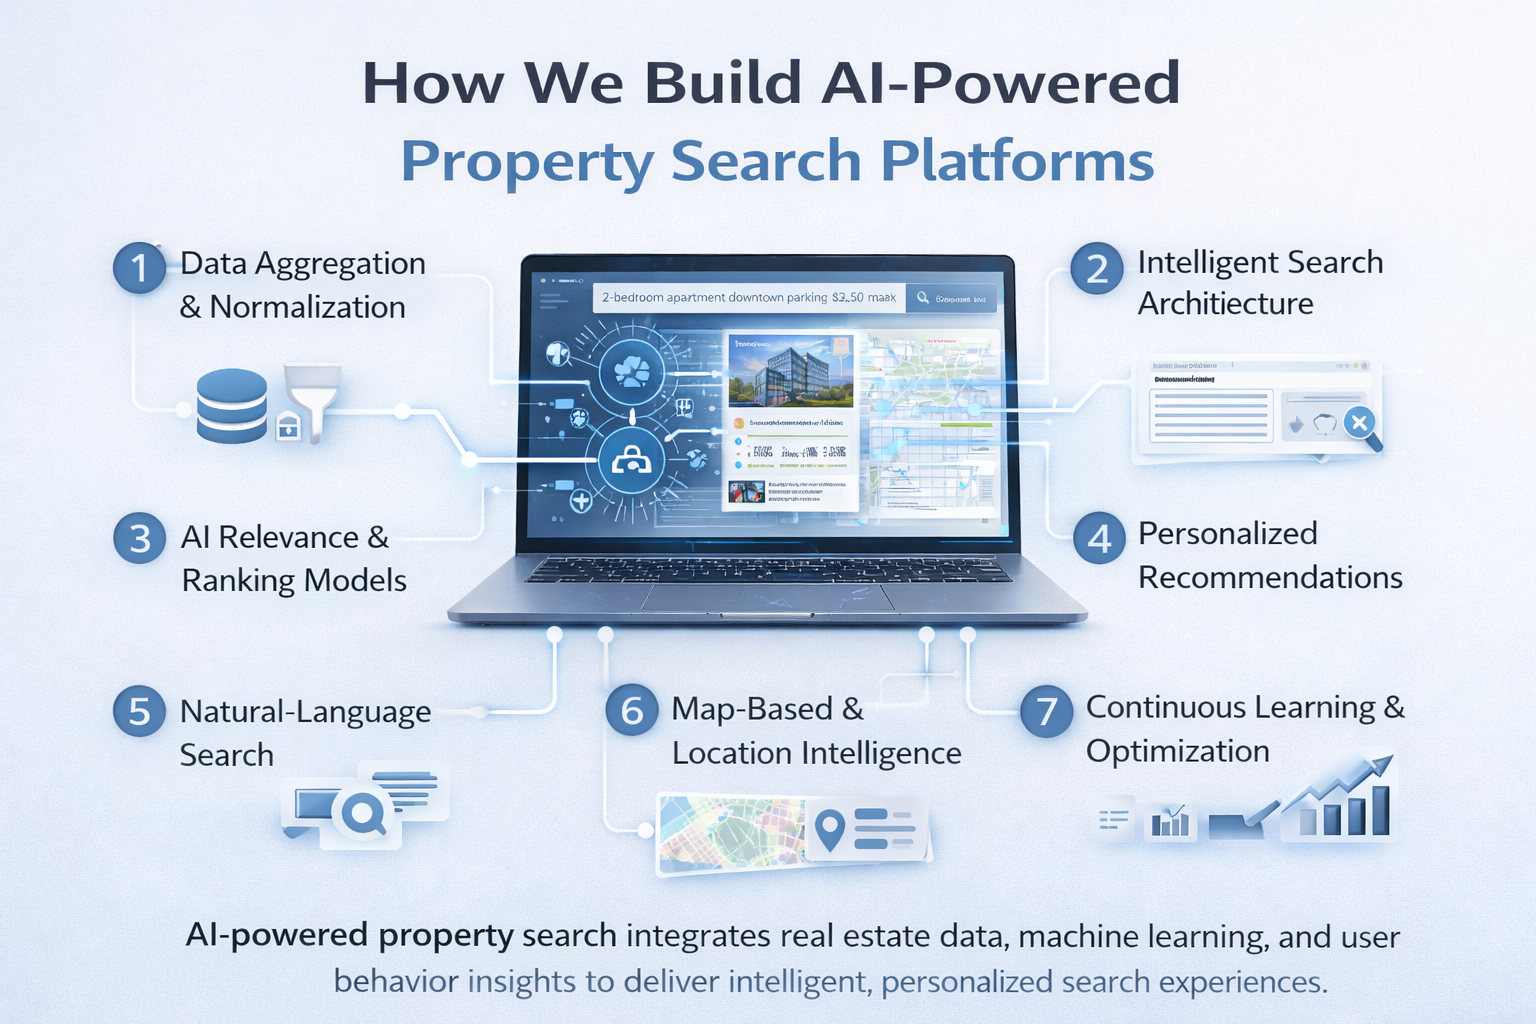
You Can Also Read- How We Build AI-Powered Property Search Platforms