What Is a Strategy Dashboard?
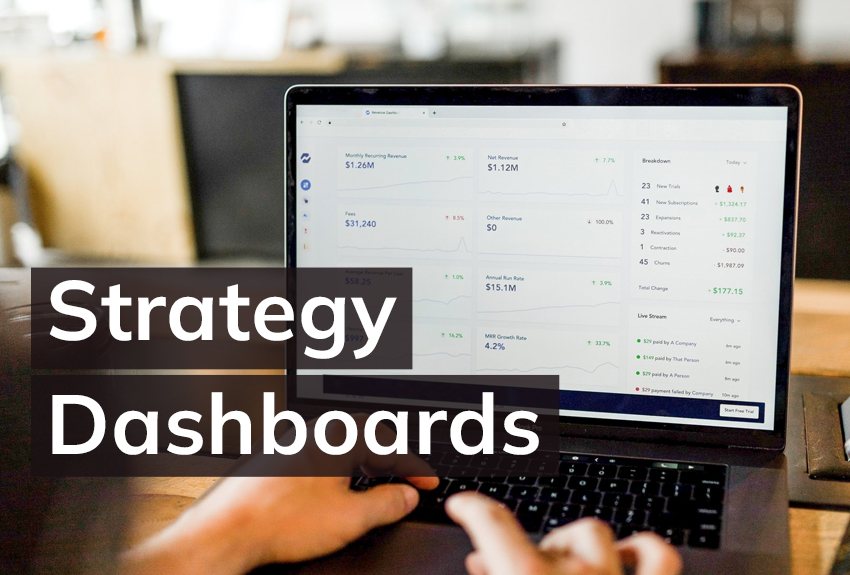
Within, and sometimes outside of, your company, individuals will have to make important decisions about how they invest their money and resources. Within the company, managers and even board members will decide how to allocate their budgets based on key performance data. Outside of the company, investors and partners want detailed reports of your mobile app performance, for example, before they invest in a project. To avoid any critical mistakes, these different audiences will ideally have quality data on which to base their various decisions. A strategy dashboard, or a graphic report on your business’s KPI’s and overall performance, can help your audience with decision-making at all levels.
The purpose of putting together a strategy or “operational” dashboard is to help those from the “C” (CEO, CFO, COO and etc.) level down to the consumer level more confidently proceed with investments and development vis-à-vis your business.
The dashboard aims to synthesize large amounts of data into clear, digestible graphics. As any data-cruncher will tell you it would be impossible to include all the raw data pertaining to your business in a single Google Slides document or poster-board. Rather, the strategy dashboard displays relevant performance metrics only, giving an efficient, direct report tailored to the expertise and personality of the audience.
Who Is Your Strategy Dashboard’s Target Audience?
Important to consider with strategy dashboards: every audience is different. How you build your dashboard hinges heavily on the responsibilities and technical knowledge of your audience. Before you dive in on the data, you may first want to consider ‘who will see this dashboard?’ and ‘what decisions do my audience intend to make based on these figures?’
Managers, Executives and the “C” Level
For many businesses, strategy dashboards exist solely to help managers and officers from the “C” level make macro-level decisions about where to invest the company’s time, funds and manpower. Depending on the industry you work in, these time-pressed managers may want to see data from specific sectors while caring less about other sectors of the business.
We can use a food distribution company as a theoretical example: a CFO in this field may care less about investments in farming and growing crops, as these tend to be one-time, sunk costs. On the other hand, the CFO may care a lot about sales and marketing performance in particular geographic regions, especially their ‘bread-and-butter’ vendors from whom the company receives their biggest revenues. A strategy dashboard presented to this executive may forgo in-depth summaries of crop growth and instead drill-down on sales and revenue data.
Dashboards for Your Internal Team
Sometimes you may be tasked with presenting a dashboard to your peers within the company. Yes, you must include substantive data in your report, but your team may not be making the same high-level decisions that your company’s board makes. Instead, team-oriented strategy dashboards aim to stimulate motivation and engagement.
Because your team members are the ones working on the projects involved with KPIs, revenue, partnerships and performance metrics, you want to find ways to affirm your team’s hard work. A strategy dashboard can be a graphic way to take stock of your team’s assets and while also displaying necessary areas for growth.
Finally, with these team-facing dashboards you may even reference team inside-jokes or other fun, humorous elements. As your goal is motivation and engagement, you can at times step outside of the realm of data and numbers to raise morale and earn buy-in from your team.
Dashboards for the Public
Strategy dashboards can also be part of public case studies and even marketing campaigns. The goal with public-facing dashboards is not to spill the beans on your company’s profit-losses or business strategies, but rather to engender good faith and excitement amongst the consumer audience.
As social issues continue to trend towards ubiquity, companies in all fields are learning to prioritize accountability especially with regards to environmental and social responsibility. Public-facing strategy dashboards can help build good faith from your audience if implemented judiciously and transparently.
If you want to create a public-facing strategy dashboard, you want to avoid technical language and jargon that a general audience has no familiarity with. However, you can highlight the owners of each internal project on a dashboard to give credit and morale to those who are performing well within your company.
Amongst the metrics you choose to include, you may want to highlight your company’s attempts to reduce carbon emissions, or the company’s monetary investments toward causes like racial injustice or disease research, to name a few examples.
The Final Word
From a business perspective, you want to be able to collect and synthesize key information for your team, clients and executive board. Strategy dashboards are just one way to do so, but they can be extremely helpful. Many of us react more quickly to graphic images than we do to raw numbers or words, and communicating quickly and clearly lies at the top of any thriving company’s priority list. Let OpenSource help you build strategy dashboards that can help you report on any aspect of your business, to any audience you may have.


